

DataPower Memory and Performance: Understanding What Normal Looks Like (Before You Open a Ticket)
• • by
•
Chris Phillips


•
IBM Bob
Rising memory on a DataPower appliance is not automatically a problem — but knowing whether it is requires understanding what the numbers actually mean.
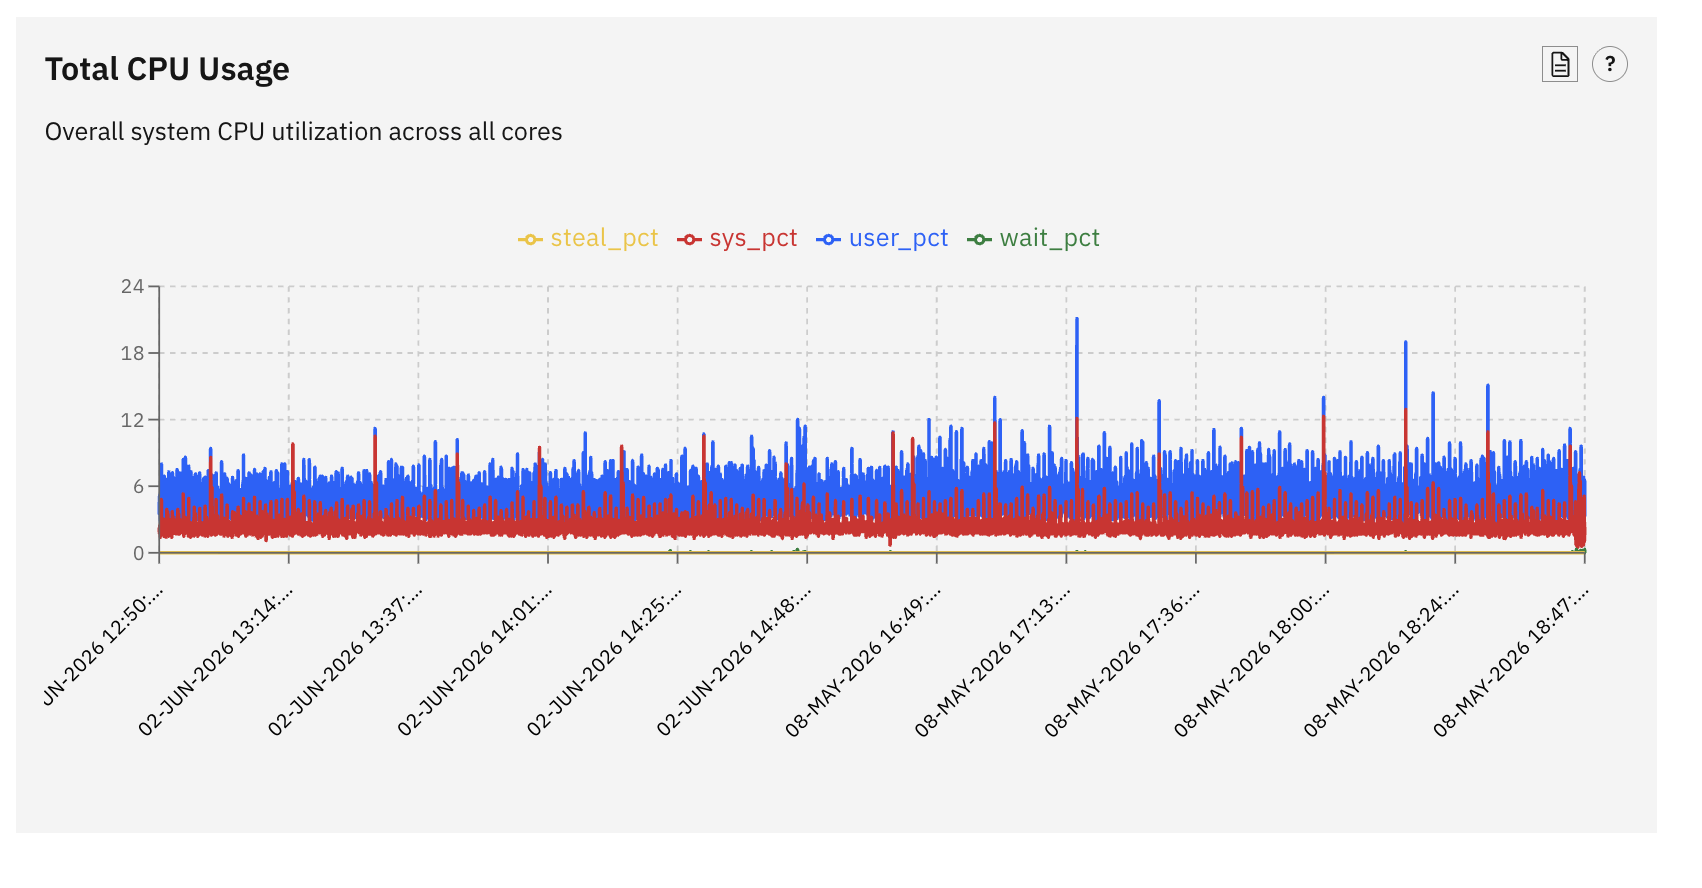
Comparing raw memory percentages between HA pair appliances is misleading. Two appliances with identical firmware and configuration can show different memory usage simply because one has been running longer or has a warmer cache.
1. How DataPower Allocates Memory
DataPower divides memory into several regions:
- Firmware-reserved: The OS and DataPower firmware services reserve a fixed portion. It is not available for application use.
- Domain memory: Each domain has its own chunk. Domains process API traffic and hold configurations.
- Application buffers: Used for XML parsing, JSON processing, HTTP connection handling, and XSLT transformations. Allocated from a shared buffer pool.
- Compilation cache: GatewayScript and XSLT compiled code is cached in memory. More traffic means more compiled code, which means more memory used.
- Filesystem regions (
temporary,image,internal): These count as physical memory usage.temporaryis used by API Connect and gateway peering to load shared state.internalis where GatewayScript and XSLT are compiled and executed.imageholds firmware and domain package data. None of this shows up at startup — it accumulates as caches warm, APIs are deployed, and peering loads its data. This is expected growth, not a leak.
The show memory output from the CLI (IBM docs: show memory):
DataPower# show memory

Memory usage:      62%
Installed memory:  8388608 KB
Available memory:  3145728 KB
Used memory:       5242880 KB
Reserved memory:   1048576 KB
Total memory:      7340032 KB
Requested memory:  4915200 KB
Hold memory:       131072 KB
Inactive memory:   524288 KB
Fields to know:
- Installed memory — total physical RAM on the appliance.
- Total memory — memory available to DataPower after firmware overhead.
- Used memory — memory actively in use.
- Available memory — free memory. Watch this trending over time; consistent day-over-day drops without traffic growth indicate a leak.
- Reserved memory — pre-allocated for internal use, not available to services.
- Requested memory — memory requested by running processes (can exceed Used when memory is fragmented).
- Hold memory — memory held by the system that has been freed by processes but not yet returned to the pool.
- Inactive memory — memory allocated but not recently accessed. DataPower can reclaim it under pressure. A large inactive pool is normal and healthy; it means the system is caching aggressively. It only becomes a concern if Available drops while Inactive is also near zero.
Note that show memory is system-level — per-domain breakdown is in the error report’s DomainsMemoryStatus2.xml. The per-domain figures in that file must be treated as indicative rather than precise.
2. Normal Memory Growth vs. Genuine Memory Leak
Expected growth happens in three scenarios:
- New APIs deployed → new domain configurations loaded → more domain memory
- Traffic growth → more application buffers allocated
- Longer uptime → larger compilation cache, and more data loaded into
temporary(API Connect/gateway peering state) andinternal(compiled GatewayScript/XSLT). This is why memory on a freshly restarted appliance will always look lower than the same appliance after a few hours under load.
Leak indicators:
- Available memory (system-level) drops by more than 10% per day with no change in traffic or configuration
- After restarting a domain (not the appliance), system-level memory does not return to baseline
Note: Genuine memory leaks will not show up in the domain/service-level memory status providers (
DomainsMemoryStatus2.xml). That is precisely why they are leaks — the accounting doesn’t capture them. If you suspect a leak, track it at the system level viashow memoryandMemoryStatus2.xmlover time.
Diagnosing with an error report:
Generate one with:
generate error-report
Relevant files for memory leak diagnosis:
MemoryStatus2.xml— system-level snapshot (Usage,AvailableMemory,UsedMemory,TotalMemory). This is the primary file for leak detection — trackAvailableMemoryover time.DomainsMemoryStatus2.xml— per-domain memory counters. These figures have known accuracy limitations and will not reveal a genuine memory leak (leaks don’t surface in domain-level accounting). Use them as a rough guide to which domain is the largest consumer, not as precise measurements.DocumentCachingSummary.xml— per-XMLManager document cache (DocCount,CacheSizeKiB).StylesheetCachingSummary2.xml— per-XMLManager stylesheet cache (CacheCount,CacheKBCount).
Example DomainsMemoryStatus2.xml entry:
<DomainsMemoryStatus2>
  <Domain>apiconnect</Domain>
  <ServicesCurrent>0</ServicesCurrent>
  <ServicesOneMinute>0</ServicesOneMinute>
  <ServicesFiveMinutes>0</ServicesFiveMinutes>
  <ServicesTenMinutes>0</ServicesTenMinutes>
  <ServicesOneHour>0</ServicesOneHour>
  <ServicesTwelveHours>0</ServicesTwelveHours>
  <ServicesOneDay>0</ServicesOneDay>
  <ServicesLifetime>0</ServicesLifetime>
  <DocumentCaches>0</DocumentCaches>
  <StylesheetCaches>0</StylesheetCaches>
</DomainsMemoryStatus2>
If ServicesLifetime is growing steadily while ServicesCurrent is stable and traffic is flat, it may indicate configuration growth or cache accumulation in that domain — but confirm against system-level memory trends in MemoryStatus2.xml before concluding it is a leak. A genuine memory leak will not be visible here.
3. CPU Spikes: Three Most Common Causes
Cause 1: Burst traffic
A sudden increase in API calls — a batch job starting, a partner system spiking — will drive CPU up as DataPower processes the requests. Correlate the spike with request logs showing increased traffic volume. If it subsides when the burst ends, it is normal.
Cause 2: Large payload processing
Multi-megabyte XML or JSON payloads (common in B2B and file transfer APIs) cause brief CPU spikes during parsing, validation, and transformation. Use show statistics to check global connection counts and correlate with the spike. This is expected for large payloads, but becomes a problem if partners start sending payloads above your configured limits.
Cause 3: First-call XSLT/GatewayScript compilation
The first call after a domain restart or a new deployment compiles XSLT stylesheets and GatewayScript modules. Compilation is CPU-intensive. Subsequent calls use the cached version and are significantly faster. If the spike happens once and does not recur, this is the cause. If it happens repeatedly, the compilation cache is too small.
Collecting CPU data for a support case:
# Firmware version — include in every support case
show version

# System identity, serial number, uptime
show system

# Global statistics (CPU over 10s/1m/10m/1h/24h, connection counts,
# memory, stylesheet compilation times) — requires statistics collection enabled
show statistics

# CPU usage intervals (10s / 1m / 10m / 1h / 24h)
show cpu

# Current memory usage (system-level)
show memory

# TCP connection summary — often more revealing for CPU cases than anything else
show tcp-conn

# Full TCP connection table
show tcp-table
Note:
show statisticsandshow cpuare global commands — they do not accept adomainparameter. Per-domain memory metrics are in the error report’sDomainsMemoryStatus2.xml.
4. What to Collect Before Opening a Performance Support Case
# Generate error report
generate error-report

# Key files to inspect:
# - MemoryStatus2.xml              — system memory (Usage, AvailableMemory, UsedMemory, TotalMemory)
# - DomainsMemoryStatus2.xml       — per-domain memory (ServicesOneDay, ServicesLifetime, DocumentCaches)
# - SystemUsage.xml                — CPU load (Load field, 0–100 scale)
# - DocumentCachingSummary.xml     — document cache per XMLManager (DocCount, CacheSizeKiB)
# - StylesheetCachingSummary2.xml  — stylesheet cache per XMLManager (CacheCount, CacheKBCount)
# - HTTPConnections.xml            — HTTP connection pool stats (reqTenSec through reqOneDay)
show memory
show statistics
show cpu
show tcp-conn
show tcp-table
generate error-report
# Then inspect DomainsMemoryStatus2.xml for per-domain memory counters.
# Remember: genuine leaks will not appear in per-domain figures — use MemoryStatus2.xml.
ExtLatency: If the problem is performance (latency, slow response times) rather than a memory leak, enable Extended Transaction Logging (ExtLatency) before collecting further data. This is not enabled by default but is the single most useful data source for diagnosing latency problems. Enable it under Administration → Device → Extended Transaction Logging in the WebGUI, or via the CLI in the relevant domain.
Note:
show domain-memory,show connections,show cpu domain all, andshow xml-managersare not valid standalone CLI commands. Useshow statisticsfor global connection counts,show cpufor CPU intervals, and the error report for per-domain detail.
5. How DataPower Throttles Under Memory Pressure
When memory runs low, DataPower engages a throttling mechanism before it reaches a critical state. There are three thresholds to understand (IBM docs: Memory Management):
Throttle At (% memory remaining) When available memory drops to this percentage, DataPower begins denying new incoming connections. It is not dropping traffic arbitrarily — it is buying the appliance time to complete the work already in flight and reclaim memory back below the threshold. Existing connections continue to be processed normally.
Timeout Once throttling begins, this is the window DataPower has to recover. If available memory does not climb back above the Throttle At threshold within this time, DataPower performs a Throttler Reload — a controlled firmware restart. The purpose is graceful recovery: completing or draining in-flight transactions, preserving data integrity, and returning the appliance to a known-good state.
Terminate At (% memory remaining) A hard safety net. If memory continues to fall below this value even while throttling is active, DataPower does not wait for the timeout — it starts the Throttler Reload immediately. This guards against runaway memory growth that throttling alone cannot stop.
The Throttler Reload is not a crash — it is a deliberate, controlled action to protect the appliance and its data. The sequence is: throttle → allow time to recover → reload if recovery fails or if memory hits the hard limit.
Configure these thresholds in the WebGUI under Administration → Device → Memory Management (IBM docs: Configuring memory thresholds).
6. Performance Tuning Levers
Document cache sizing:
Configure via Objects → XML Manager → [your XML manager] → Document Cache in the WebGUI, or via the CLI in the relevant domain context. Tune the maximum number of cached entries and the TTL. High first-call latency with low subsequent latency means the cache is too small. Memory growing without traffic growth means the TTL is too long.
Connection pool configuration:
Set per Multi-Protocol Gateway or HTTP Front Side Handler. The defaults are tuned for balanced workloads. Only change them if you have evidence of pool exhaustion — look for connection refused or connection pool full errors in the DataPower log.
Thread count:
Do not change thread count without IBM guidance. Increasing beyond firmware-recommended values can decrease performance through excessive context switching.
7. Five Questions Before You Call IBM
- Is the appliance still processing traffic? If yes, are response times degraded or is it fully functional? Get the exact numbers before and after.
- What changed immediately before the issue started? New API, firmware upgrade, configuration change, traffic pattern change?
- Is the issue on one appliance or both in the HA pair? If one, is it primary or secondary? What does HA status show?
- Is Available memory decreasing consistently day-over-day, or has it plateaued? Provide a graph over at least 48 hours.
- What error messages appear in the DataPower logs? Export the relevant entries. Never describe errors — show them.
Screenshots of CPU and memory graphs are worth more than written descriptions.