

Deep Dive: API Connect Impact Analysis Tool v3.0 - Understanding Your API Ecosystem Dependencies
•
by
Chris Phillips

Draft!!
Understanding the complex web of dependencies in your API Connect environment is crucial for successful API management. When you need to make changes—whether updating a backend service, modifying a product, or understanding which applications will be affected—you need clear visibility into these relationships. Today, I’m excited to share a deep dive into the API Connect Impact Analysis Tool (APICIA) v3.0, a powerful command-line utility that maps out these dependencies with unprecedented clarity.
The Challenge: API Connect Dependency Complexity
In any mature API Connect deployment, you’ll find yourself dealing with:
- Multiple catalogs (Sandbox, Development, Production)
- Dozens or hundreds of APIs
- Complex product and plan structures
- Numerous applications with varying subscriptions
- Backend services spread across different hosts
- Security configurations and policies
When you need to answer questions like “Which applications will be affected if I change this backend service?” or “What APIs are using this specific policy?”, manually tracing these relationships through the API Manager UI becomes time-consuming and error-prone.
Enter APICIA: Your API Dependency Analyzer
APICIA is a Go-based command-line tool that connects to your API Connect instance, analyzes your entire configuration, and presents the relationships in multiple formats—from simple tree diagrams to interactive HTML visualizations. Let me show you what makes this tool indispensable.
Download
You can download the latest version of APICIA from my repos GitHub releases page. The tool is distributed as a single portable binary with no installer or external dependencies, making it easy to run.
Initial Configuration
Running the tool for the first time launches an interactive configuration wizard:
./apicia
You’ll be prompted for:
- API Connect Server URL: Your API Manager endpoint (e.g.,
https://api-manager.example.com) - Credentials: Username and password (password is base64-encoded in the config file)
- Organization: Your provider organization name
- Realm: Typically
provider/default-idp-2 - Catalogs: Which catalogs to analyze (you can select multiple)
- Display Schema: How to organize the output hierarchy
- Data Type: What to analyze (Invokes/Proxies, Policies, or Security)
The configuration is saved to .apicia in your current directory, so subsequent runs are instant.
Command-Line Options Reference
Here’s the complete set of command-line flags available in APICIA v3.0:
$ ./apicia --help

APICIA - API Connect Impact Analysis

Understanding interdependencies between the API Components and the back-end Service
is critical for a successful business. The purpose of this tool is to assess an API
Catalog on API Connect and return the dependencies between the APIs, Applications,
Products, Plans and Backend Services in a simple and human-readable form.

Usage:
  apicia [flags]

Flags:
      --csv           Output in CSV format
      --debug         Enable debug mode
      --file string   Save output to file
  -h, --help          help for apicia
      --html          Output in interactive HTML format with collapsible trees and filtering
      --json          Output in JSON format
      --load string   Load config from file
  -v, --version       version for apicia
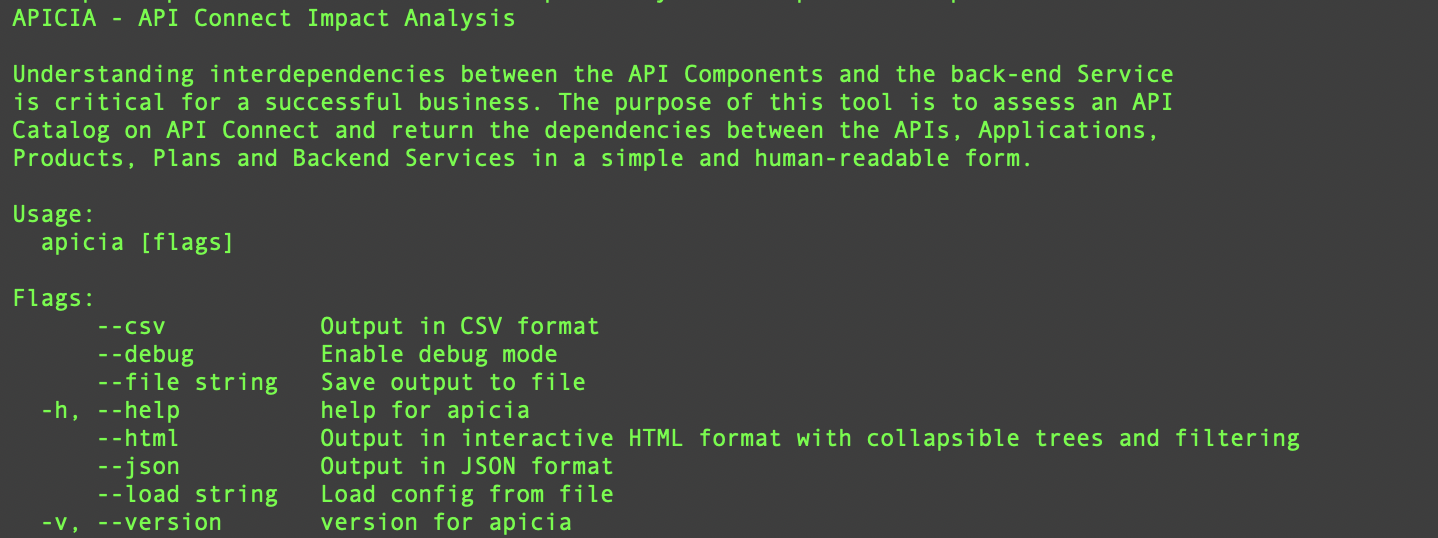 Figure 1: APICIA command-line help showing all available options
Output Formats: Choose Your View
APICIA supports four distinct output formats, each suited for different use cases.
1. Tree Format (Default)
The tree format provides a clean, hierarchical view in your terminal:
./apicia
Output example:
Sandbox
├── Service Host - https://httpbin.org
│   ├── Service ContextRoute - /ip
│   │   ├── API - DemoAPI : 1.0.0 (/demoapi)
│   │   │   ├── Product - DemoProduct : 1.0.0
│   │   │   │   ├── Plan - default
│   │   │   │   │   ├── Application - TestApp
│   │   │   │   │   │   └── Consumer Organization - TestOrg
Use Case: Quick terminal-based analysis, CI/CD pipeline integration, or when you need a simple text output.
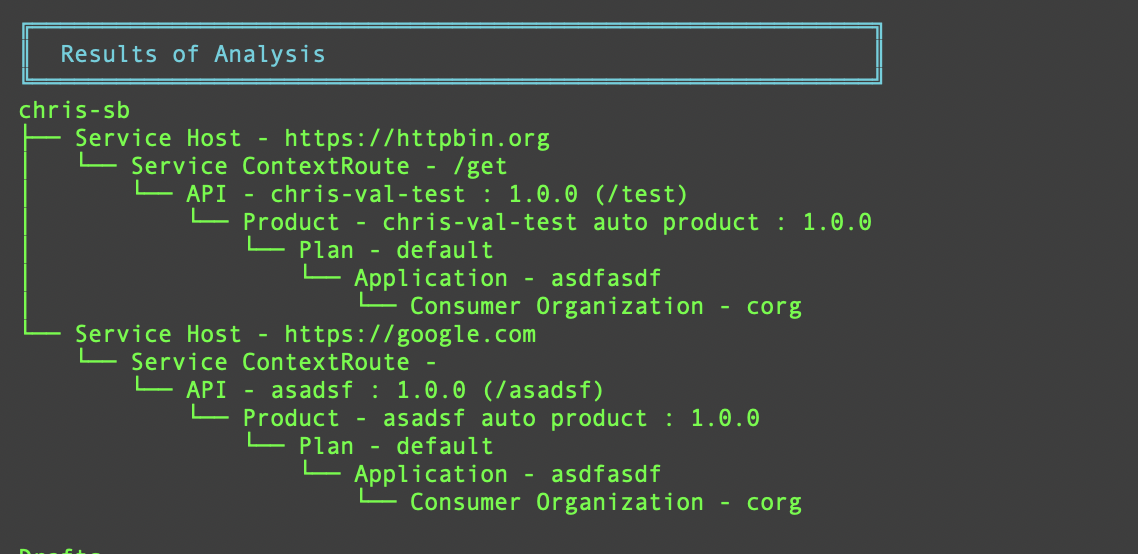 Figure 2: Tree format output showing hierarchical dependencies in the terminal
2. JSON Format
For programmatic processing or integration with other tools:
./apicia --json --file output.json
The JSON structure mirrors your display schema, making it easy to parse and process with scripts or other tools.
Use Case: Automation, integration with monitoring systems, or feeding data into custom dashboards.
3. CSV Format
Perfect for spreadsheet analysis or data processing:
./apicia --csv --file output.csv
Each row represents a complete path through your hierarchy, making it easy to filter, sort, and analyze in Excel or similar tools.
Use Case: Reporting, data analysis, or sharing with non-technical stakeholders.
4. Interactive HTML Format (The Game Changer)
This is where APICIA truly shines:
./apicia --html
The tool generates a self-contained HTML file with a timestamp and server/org information in the filename:
apicia_20260124_233040_small-mgmt-api-manager-cp4i_apps_buttons_hur_hdclab_intranet_ibm_com_amit-porg.html
 Figure 3: APICIA generating an HTML report with auto-generated filename
Interactive HTML: A Deep Dive
The HTML output transforms static analysis into an interactive exploration tool. Let me walk you through its features.
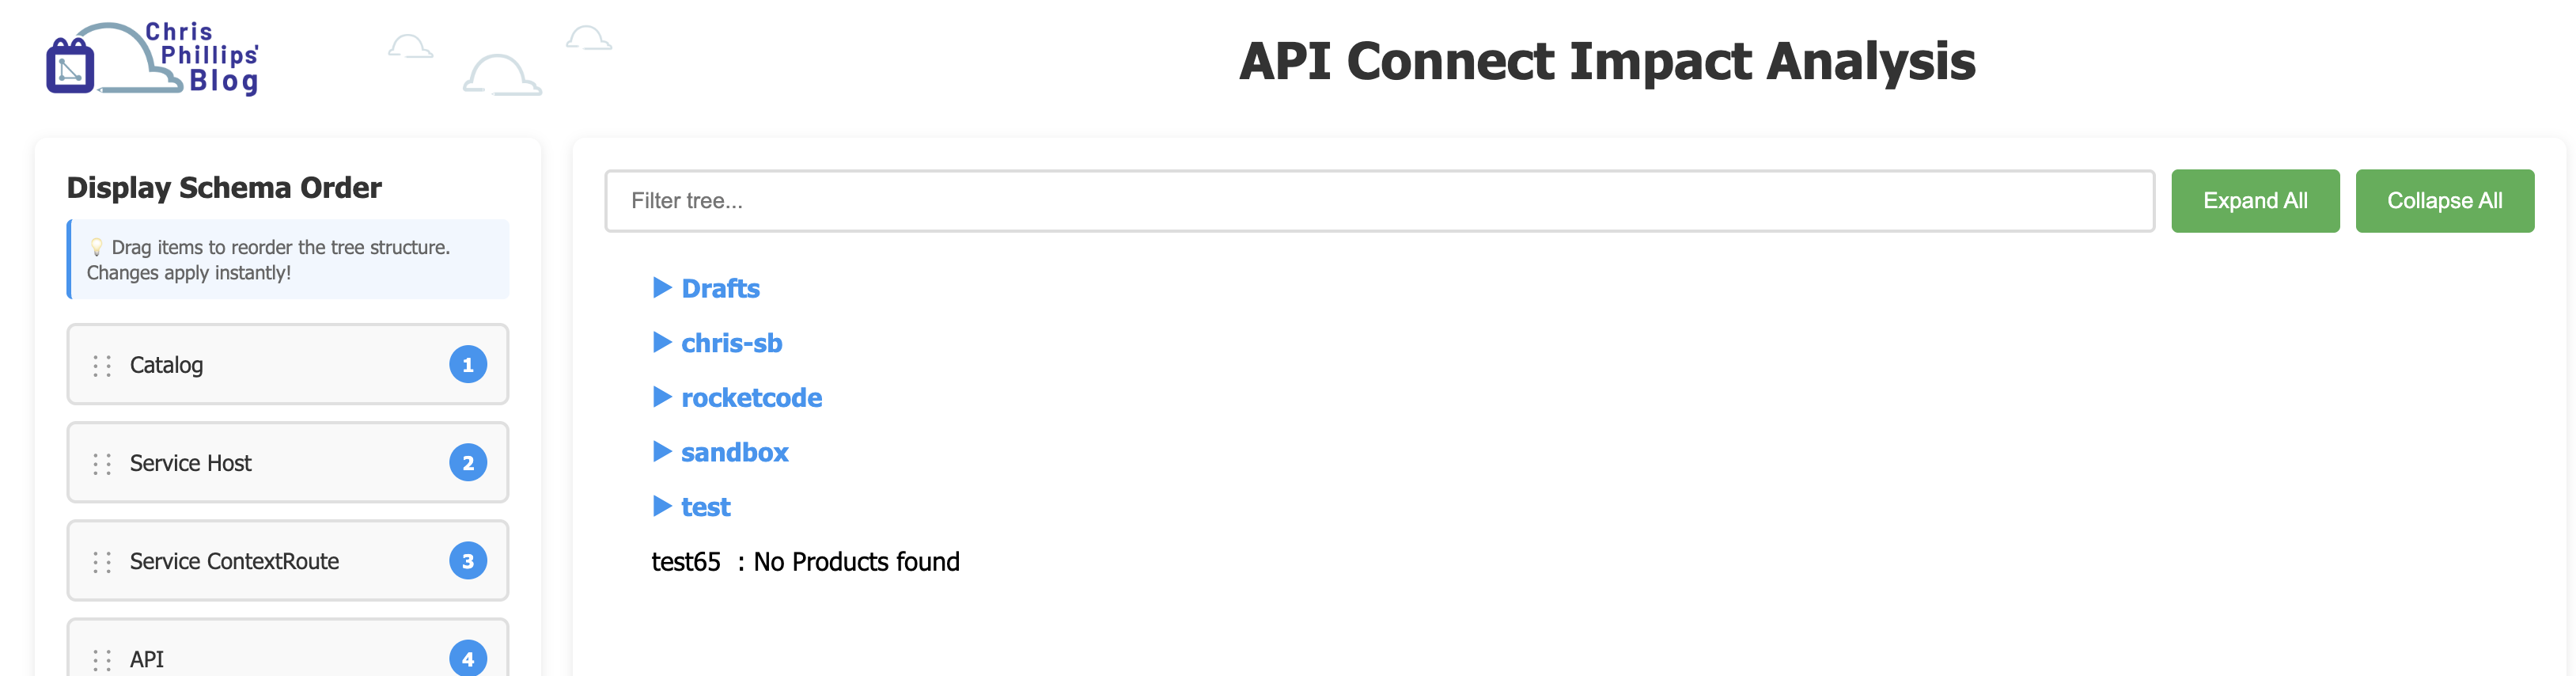 Figure 4: Complete HTML interface showing schema panel, filter controls, and tree view
Dynamic Schema Reordering
One of the most powerful features is the ability to reorganize your data hierarchy on the fly. The left panel shows your display schema with drag handles:
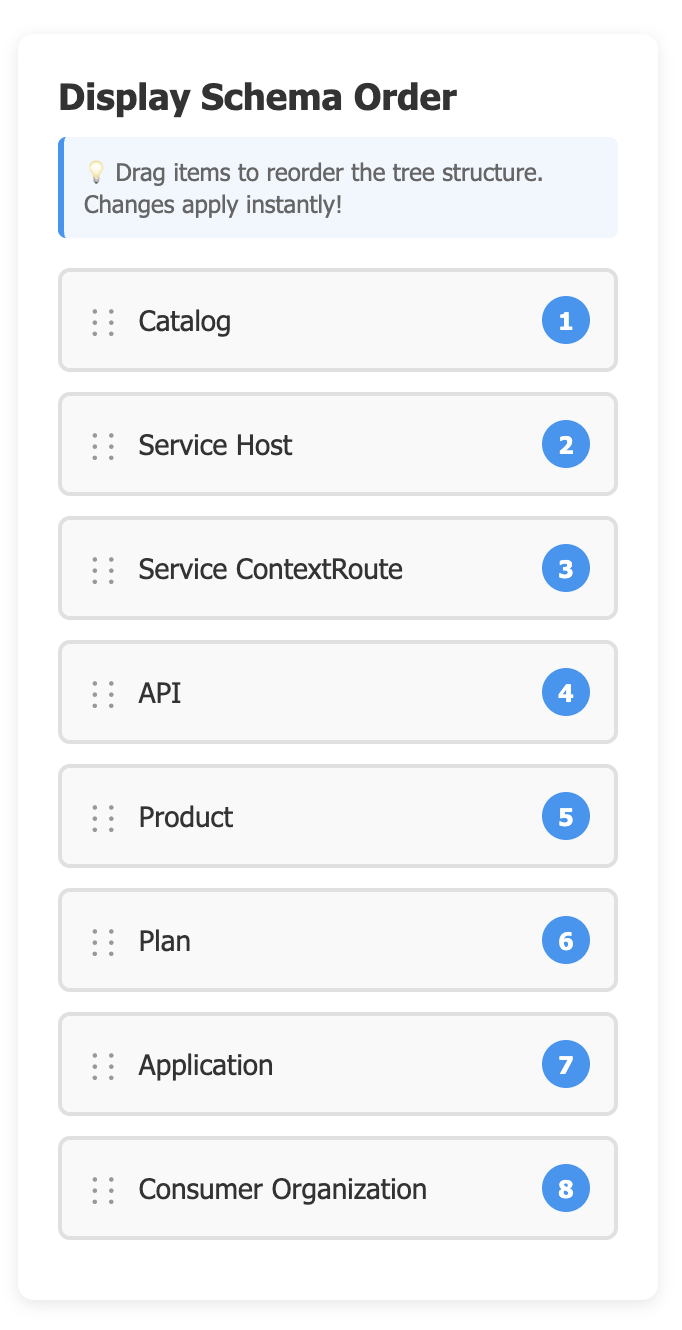 Figure 5: Schema reordering panel with drag-and-drop handles
Display Schema Order
💡 Drag items to reorder the tree structure. Changes apply instantly!

⋮⋮ Catalog                    1
⋮⋮ Service Host               2
⋮⋮ Service ContextRoute       3
⋮⋮ API                        4
⋮⋮ Product                    5
⋮⋮ Plan                       6
⋮⋮ Application                7
⋮⋮ Consumer Organization      8
Example Scenario: You want to see which Consumer Organizations are using your APIs. Simply drag “Consumer Organization” to the top position, and the entire tree reorganizes instantly to show Consumer Orgs at the root level, with all their subscribed APIs nested beneath.
Technical Implementation: The reorganization happens client-side using JavaScript, with no server round-trips. The algorithm:
- Extracts all paths from the data structure
- Assigns schema indices to each path element
- Sorts path elements by the new schema order
- Rebuilds the tree hierarchy
- Removes redundant intermediate levels
This means you can explore your data from multiple perspectives without re-running the analysis.
Intelligent Filtering
The filter box at the top provides real-time search with smart highlighting:
[Filter tree...] [Expand All] [Collapse All]
How it works:
- Type any text to search across all nodes
- Matching items are highlighted in yellow
- Complete branches (from root to leaf) are shown
- All descendants of matches are displayed
- Non-matching branches are hidden
Example: Search for “TestOrg” and you’ll see only the paths that include that consumer organization, with the complete context from catalog down to application.
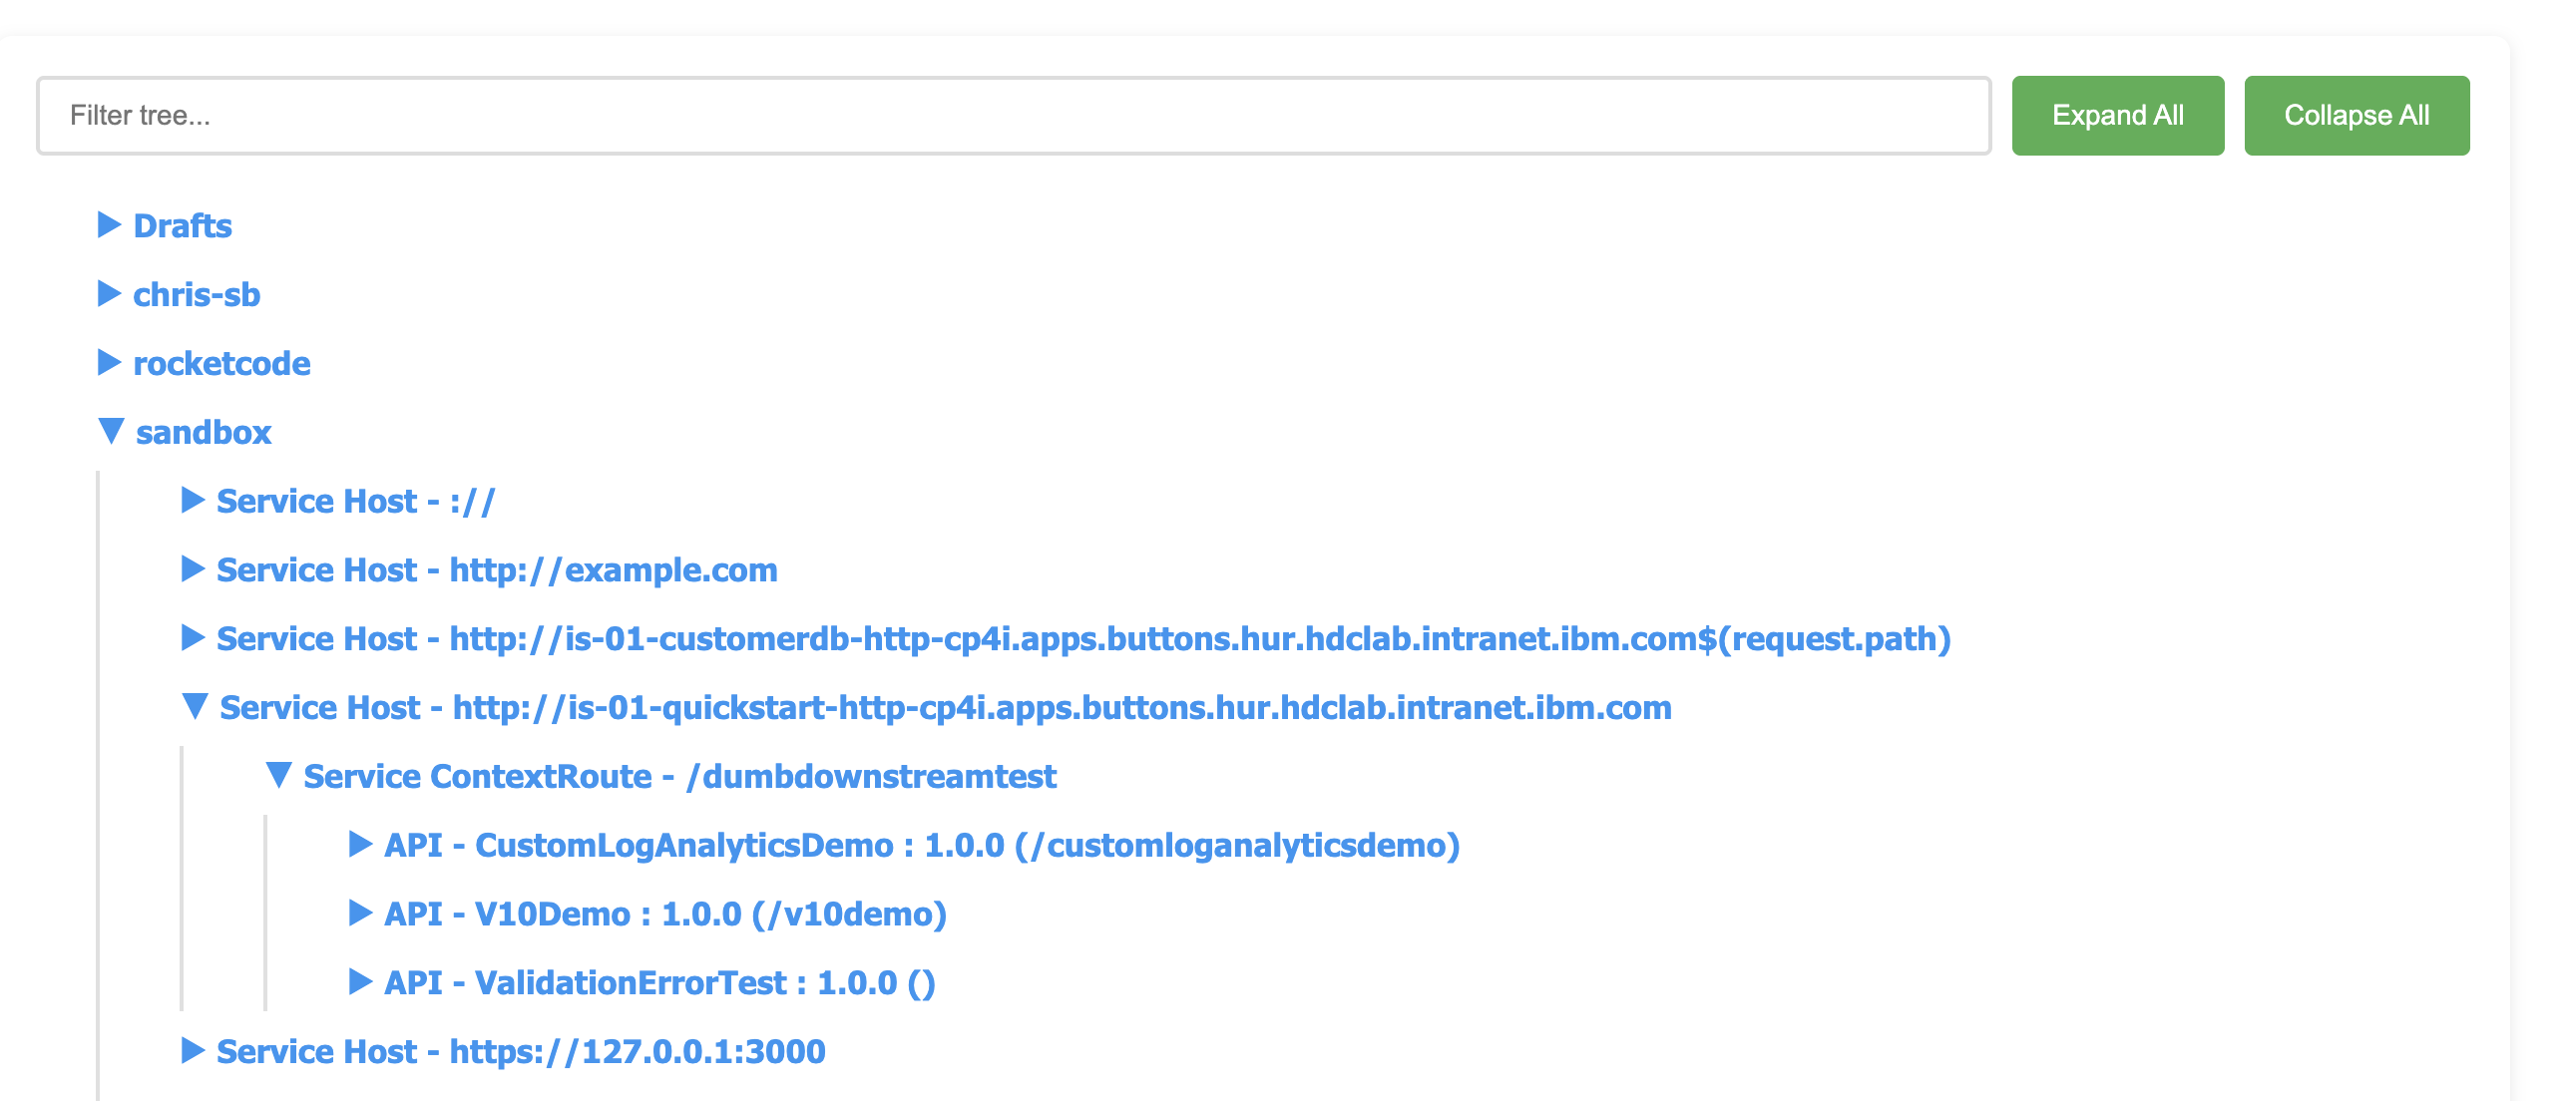
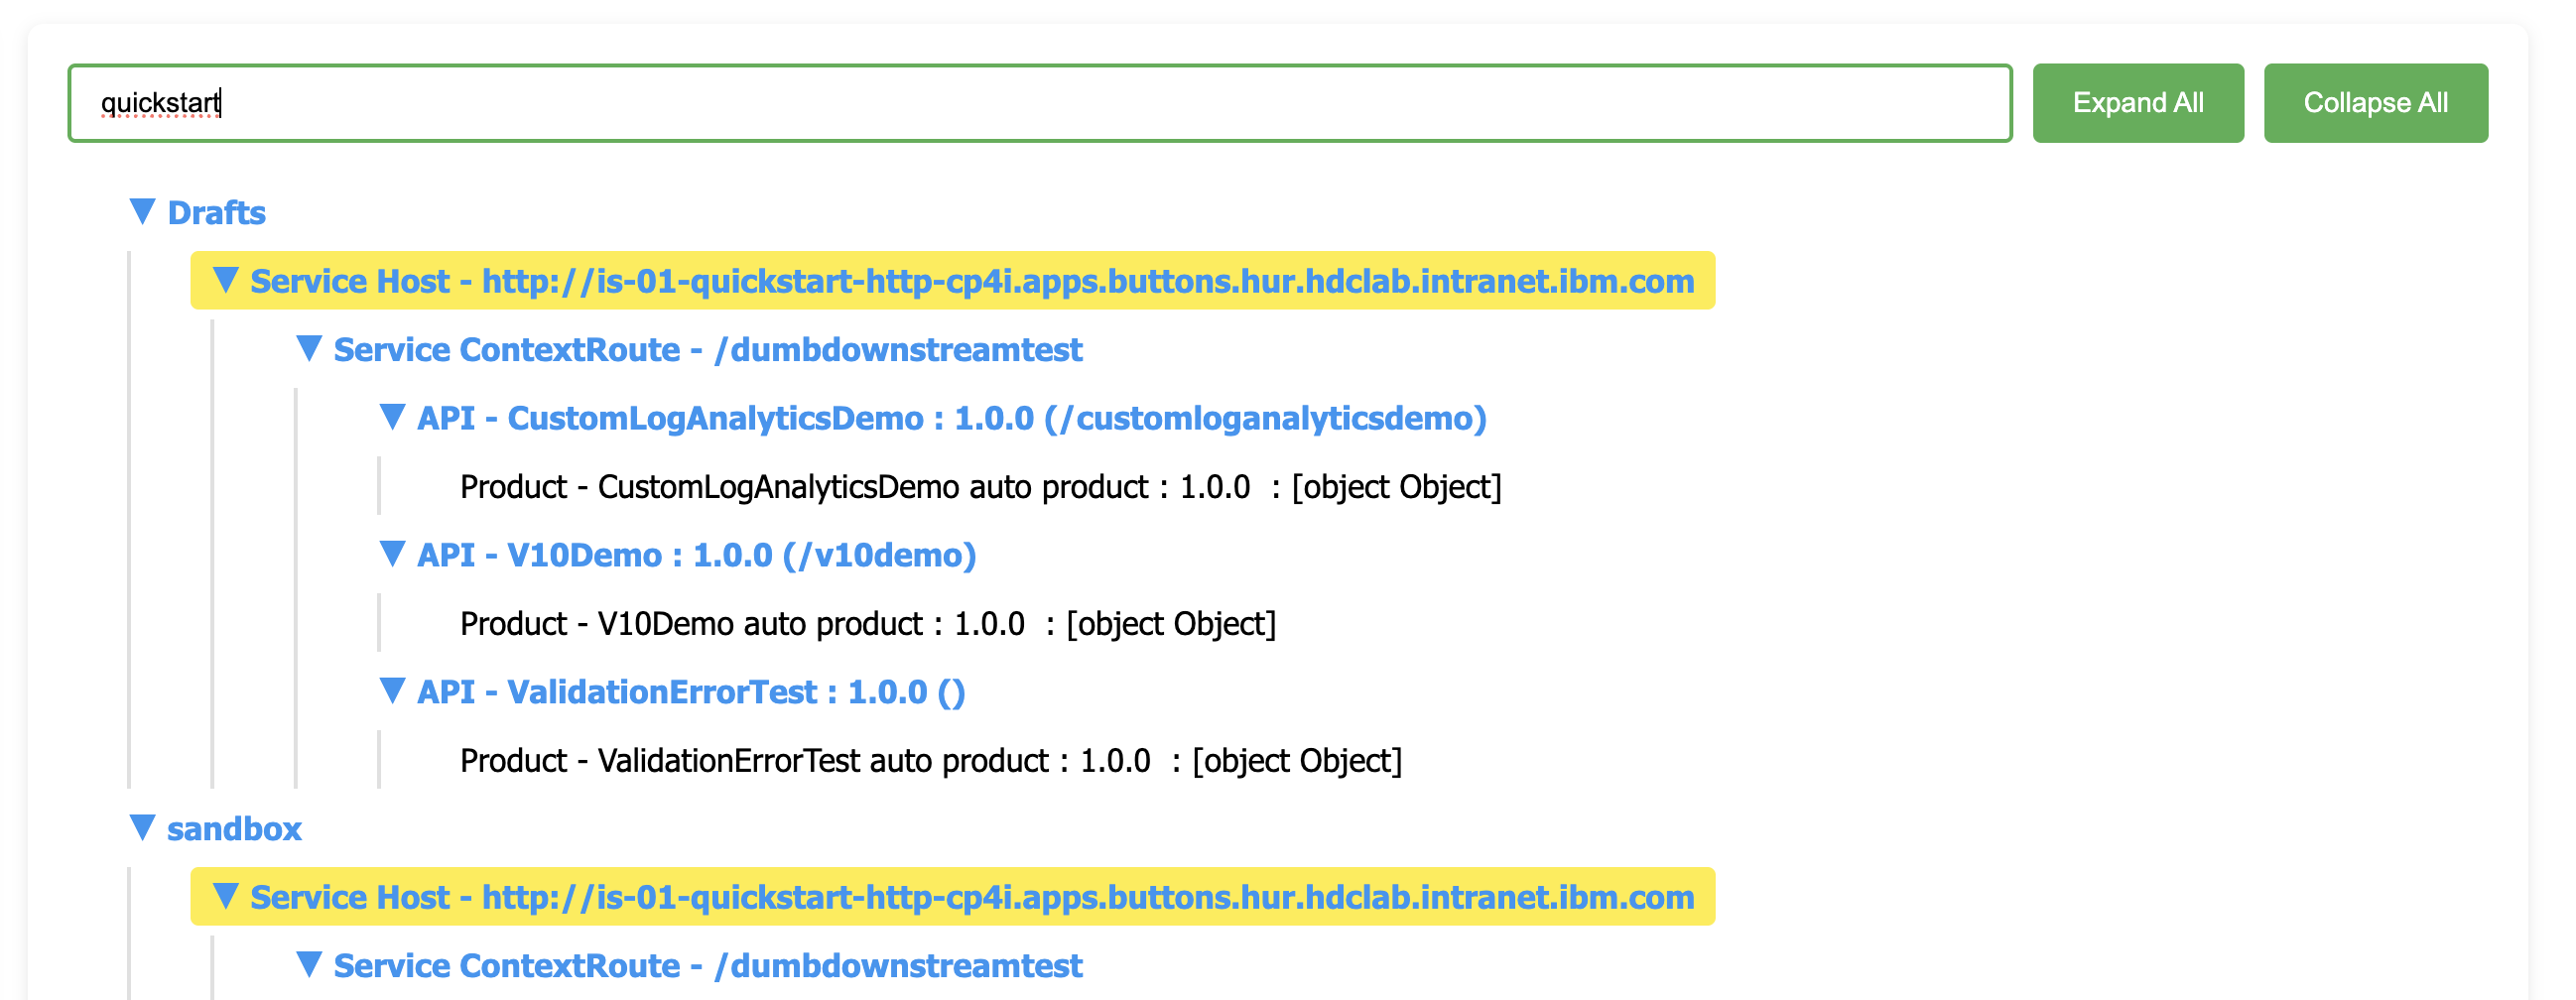 Figure 6: Real-time filtering highlighting matches and showing complete branches
Collapsible Tree Navigation
Each node with children shows an expand/collapse indicator:
- ▶ indicates a collapsed node
- ▼ indicates an expanded node
Click any node to toggle its children. Use the “Expand All” and “Collapse All” buttons for bulk operations.
Figure 7: Collapsible tree showing expand/collapse controls
Performance Note: Even with thousands of nodes, the tree remains responsive because only visible nodes are rendered in the DOM.
Responsive Design
The interface adapts to different screen sizes:
- Desktop: Side-by-side schema panel and tree view
- Tablet/Mobile: Stacked layout with collapsible schema panel
All features work identically across devices.
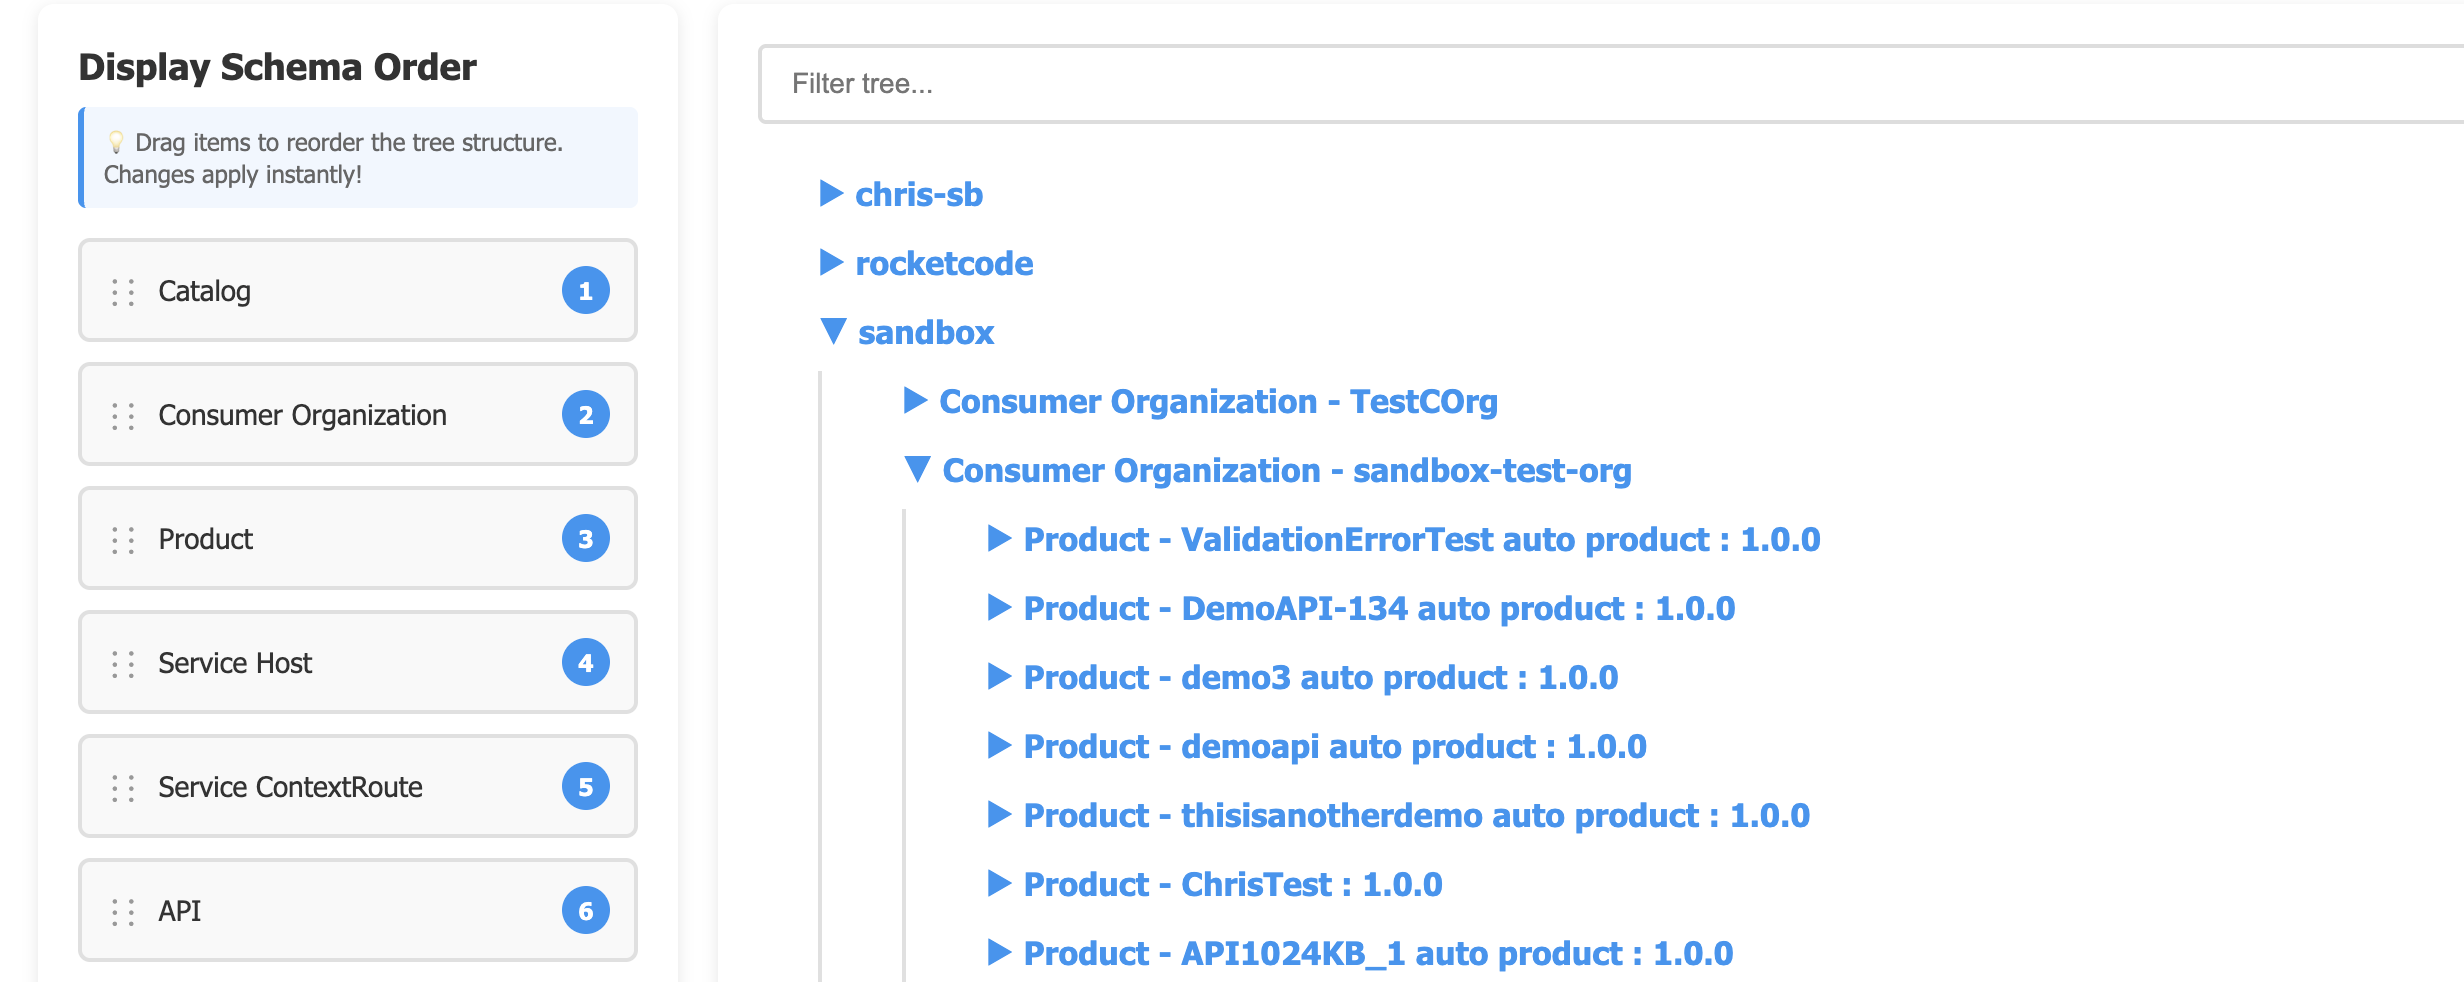 Figure 8: Responsive layout adapting to different screen sizes
Display Schema: Customizing Your View
The display schema determines how your data is organized. Here are the available schema elements:
| Schema Element | Description | Example |
|---|---|---|
| Catalog | Catalog name | Sandbox, Production |
| Service Host | Backend service hostname | https://api.example.com |
| Service ContextRoute | Backend service path | /v1/customers |
| API | API name and version | CustomerAPI : 1.0.0 |
| Product | Product name and version | CustomerProduct : 1.0.0 |
| Plan | Plan name | Gold, Silver, Bronze |
| Application | Application name | MobileApp, WebPortal |
| Consumer Organization | Consumer org name | PartnerOrg, InternalTeam |
Common Schema Patterns
Backend Service Focus:
Service Host → Service ContextRoute → API → Product → Plan
Use this when you need to understand which APIs call which backend services.
Application Focus:
Consumer Organization → Application → Plan → Product → API
Use this when you need to understand what each consumer organization is using.
Product Focus:
Product → Plan → API → Service Host
Use this when you need to understand the structure of your products.
Data Types: What to Analyze
APICIA supports three analysis modes:
1. Invokes and Proxies (Default)
Analyzes backend service calls made by your APIs:
- HTTP/HTTPS invokes
- MQ invokes
- Proxy policies
Output includes:
- Service hostnames
- Service paths
- Complete API → Product → Plan → Application chain
Use Case: Understanding backend dependencies, planning service migrations, or identifying which APIs will be affected by backend changes.
2. Policies
Analyzes policy usage across your APIs:
- Custom policies
- Built-in policies
- Policy versions
Output includes:
- Policy names and versions
- APIs using each policy
- Products and plans affected
Use Case: Policy lifecycle management, identifying deprecated policy usage, or understanding policy impact.
3. Security
Analyzes security configurations:
- OAuth2 flows (authorization URLs, token URLs, introspection endpoints)
- API keys
- Basic authentication
- Custom security schemes
Output includes:
- Security scheme types
- OAuth endpoints
- APIs using each security configuration
Use Case: Security audits, OAuth migration planning, or understanding authentication dependencies.
Performance and Scalability
APICIA is built for performance with several optimizations:
Concurrent Processing
The tool uses a worker pool (5 workers by default) to process products in parallel:
 Figure 9: Real-time progress tracking during analysis
Processing 247 product(s) across 3 catalog(s)...
  Progress [===========================>] 247/247
Benchmarks:
- Small environments (10-50 products): < 30 seconds
- Medium environments (100-500 products): 1-3 minutes
- Large environments (1000+ products): 5-10 minutes
Memory Efficiency
Unlike the original Node.js implementation, the Go version uses:
- Streaming JSON parsing
- Efficient data structures
- Minimal memory allocations
Result: 3-5x faster with lower memory footprint.
Progress Tracking
Real-time progress bar shows:
- Current progress
- Total items
- Estimated time remaining
Advanced Use Cases
CI/CD Integration
Generate reports automatically in your pipeline:
#!/bin/bash
# Generate impact analysis report
./apicia --html --file "reports/impact-$(date +%Y%m%d).html"

# Generate JSON for automated processing
./apicia --json --file "reports/impact-$(date +%Y%m%d).json"

# Parse JSON to check for specific conditions
if jq '.Sandbox."Service Host - https://deprecated-api.com"' reports/impact-*.json; then
  echo "ERROR: Deprecated service still in use"
  exit 1
fi
Multi-Environment Comparison
Analyze different environments and compare:
# Production
./apicia --load .apicia.prod --html --file prod-analysis.html

# Staging
./apicia --load .apicia.staging --html --file staging-analysis.html

# Compare the JSON outputs
./apicia --load .apicia.prod --json --file prod.json
./apicia --load .apicia.staging --json --file staging.json
diff prod.json staging.json
Application Subscription Audit
Find all applications subscribed to a specific product:
./apicia --html
# Open HTML, drag "Application" to top
# Filter for product name
# Export visible tree to CSV for reporting
Backend Service Migration Planning
Identify all APIs calling a service you’re planning to migrate:
./apicia --html
# Filter for old service hostname
# See complete list of affected APIs, products, and applications
# Use this to plan migration phases
Troubleshooting
Debug Mode
Enable detailed logging:
./apicia --debug
This shows:
- API requests and responses
- Authentication flow
- Data processing steps
- Error details
Common Issues
Authentication Failures:
Error: Failed to authenticate with API Connect
- Verify server URL (include https://)
- Check username/password
- Confirm realm (usually
provider/default-idp-2) - Ensure user has provider organization access
No Products Found:
Catalog: Sandbox
  No products found
- Verify catalog machine name (case-sensitive)
- Check organization access
- Ensure products exist and are published
Slow Performance:
- Large environments take longer (expected)
- Check network latency to API Connect
- Consider analyzing fewer catalogs
- Use
--debugto identify bottlenecks
Technical Architecture
For those interested in the internals, here’s how APICIA works:
Component Overview
┌─────────────────┐
│   CLI (Cobra)   │
└────────┬────────┘
         │
    ┌────▼────────────────────────────┐
    │   Configuration Manager         │
    │   - Load/Save .apicia file      │
    │   - Interactive prompts         │
    └────┬────────────────────────────┘
         │
    ┌────▼────────────────────────────┐
    │   API Connect Client            │
    │   - Authentication              │
    │   - REST API calls              │
    │   - Token management            │
    └────┬────────────────────────────┘
         │
    ┌────▼────────────────────────────┐
    │   Analyzer (Worker Pool)        │
    │   - Concurrent processing       │
    │   - Path building               │
    │   - Application fetching        │
    └────┬────────────────────────────┘
         │
    ┌────▼────────────────────────────┐
    │   Output Formatters             │
    │   - JSON, CSV, Tree, HTML       │
    │   - Schema reorganization       │
    └─────────────────────────────────┘
Key Algorithms
Path Building:
- For each API in each product
- Extract invoke/policy/security information
- Build path array based on display schema
- Handle applications and consumer orgs
- Add to result tree
Tree Reorganization (HTML):
- Extract all paths from nested structure
- Assign schema index to each path element
- Sort elements by new schema order
- Rebuild hierarchy
- Remove redundant levels
Filtering (HTML):
- Search all node text content
- Highlight matches
- Show complete branch (root to leaf)
- Display all descendants
- Hide non-matching branches
Comparison with Original JavaScript Version
| Feature | JavaScript | Go (APICIA) |
|---|---|---|
| Performance | Baseline | 3-5x faster |
| Memory | Baseline | 40-60% less |
| Dependencies | npm install required | Single binary |
| Concurrent Processing | Limited | Worker pool |
| Progress Tracking | Basic | Real-time bar |
| HTML Output | Static | Interactive |
| Schema Reordering | No | Yes (drag-and-drop) |
| Filtering | No | Yes (real-time) |
| Error Handling | Basic | Comprehensive |
Real-World Example
Let me walk through a complete example of using APICIA to plan a backend service migration.
Scenario: You need to migrate from https://old-api.example.com to https://new-api.example.com and want to understand the impact.
Step 1: Generate the analysis
./apicia --html
Step 2: Open the HTML file and filter for “old-api.example.com”
Result: You see:
Sandbox
└── Service Host - https://old-api.example.com
    ├── Service ContextRoute - /v1/customers
    │   ├── API - CustomerAPI : 1.0.0
    │   │   ├── Product - CustomerProduct : 1.0.0
    │   │   │   ├── Plan - Gold
    │   │   │   │   ├── Application - MobileApp
    │   │   │   │   │   └── Consumer Organization - PartnerA
    │   │   │   │   ├── Application - WebPortal
    │   │   │   │   │   └── Consumer Organization - Internal
    │   │   │   ├── Plan - Silver
    │   │   │   │   ├── Application - TestApp
    │   │   │   │   │   └── Consumer Organization - PartnerB
Step 3: Drag “Application” to the top to see it from the application perspective
Result:
Application - MobileApp
└── Consumer Organization - PartnerA
    └── Plan - Gold
        └── Product - CustomerProduct : 1.0.0
            └── API - CustomerAPI : 1.0.0
                └── Service Host - https://old-api.example.com
                    └── Service ContextRoute - /v1/customers
Step 4: Export the filtered view to CSV for your migration plan
Now you have:
- Complete list of affected APIs
- All products using those APIs
- Every application that will be impacted
- The consumer organizations to notify
Best Practices
1. Regular Analysis
Run APICIA regularly (weekly or monthly) to:
- Track environment growth
- Identify unused APIs
- Monitor application subscriptions
- Audit security configurations
2. Version Control Your Config
Store .apicia files in version control:
git add .apicia.prod .apicia.staging .apicia.dev
git commit -m "Update API Connect configurations"
3. Automate Reporting
Generate reports automatically:
# Cron job: Daily at 2 AM
0 2 * * * cd /path/to/apicia && ./apicia --html --file "/reports/daily-$(date +\%Y\%m\%d).html"
4. Use Multiple Display Schemas
Save different configurations for different views:
cp .apicia .apicia.service-view    # Service Host first
cp .apicia .apicia.app-view        # Application first
cp .apicia .apicia.product-view    # Product first
5. Combine with Other Tools
Use APICIA output with other tools:
# Generate JSON and process with jq
./apicia --json | jq '.Sandbox | keys'

# Generate CSV and analyze with awk
./apicia --csv | awk -F',' '{print $1}' | sort | uniq -c
Conclusion
The API Connect Impact Analysis Tool (APICIA) transforms the complex task of understanding API dependencies into a straightforward, visual process. Whether you’re planning a migration, auditing security, or simply trying to understand your API ecosystem, APICIA provides the insights you need.
Key takeaways:
- Multiple output formats for different use cases
- Interactive HTML with drag-and-drop reorganization
- Real-time filtering for focused analysis
- High performance with concurrent processing
- Single binary with no dependencies
- Flexible display schemas for different perspectives
The tool is particularly valuable for:
- API Architects: Understanding system design and dependencies
- Operations Teams: Planning migrations and changes
- Security Teams: Auditing security configurations
- Product Managers: Understanding product usage
- Developers: Debugging integration issues
I encourage you to try APICIA in your environment. The interactive HTML output alone is worth the installation, and the ability to reorganize your view on the fly makes it an indispensable tool for anyone managing API Connect at scale.
Live Demo
Want to see APICIA in action? Check out this terminal recording showing the complete workflow:
Figure 10: Live terminal recording showing APICIA v3.0 in action
What You’ll See in the Demo:
- Version Check: Confirming APICIA v3.0 installation
- Help Output: Exploring all available command-line options
- Configuration: Interactive setup wizard
- Analysis: Real-time progress tracking
- HTML Generation: Creating the interactive report
- Result: Opening and exploring the HTML interface
The demo showcases:
- Clean, colorful terminal output
- Progress bars for long-running operations
- Auto-generated filenames with timestamps
- Seamless workflow from start to finish
Screenshot Gallery
Here’s a visual tour of APICIA’s key features:
CLI Interface
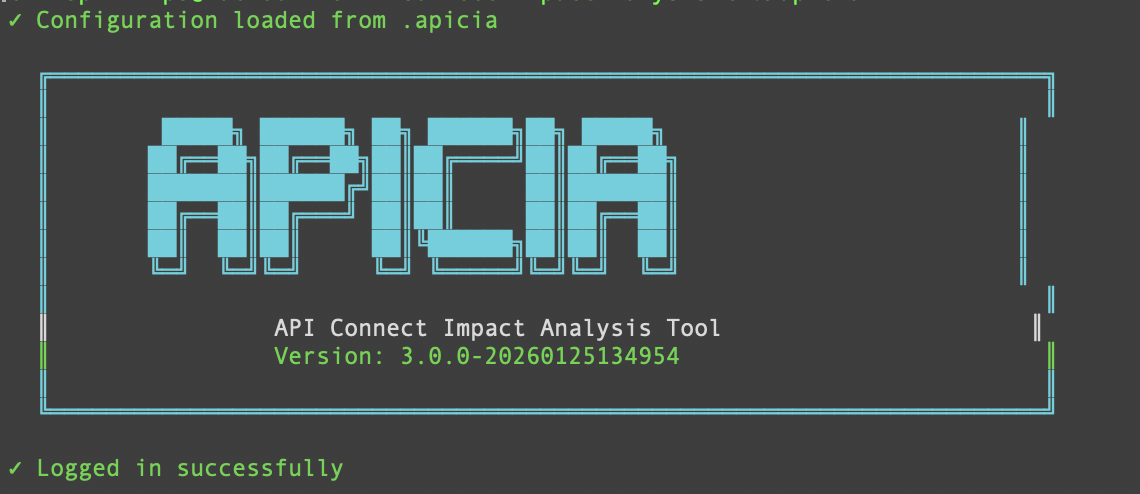 Figure 11: APICIA welcome screen with ASCII art branding
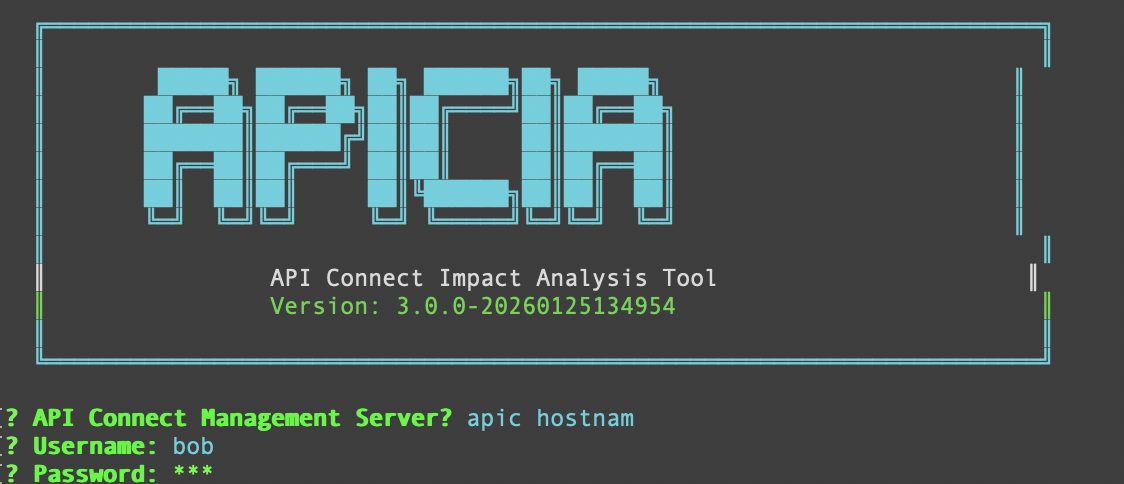 Figure 12: Interactive configuration wizard prompting for settings
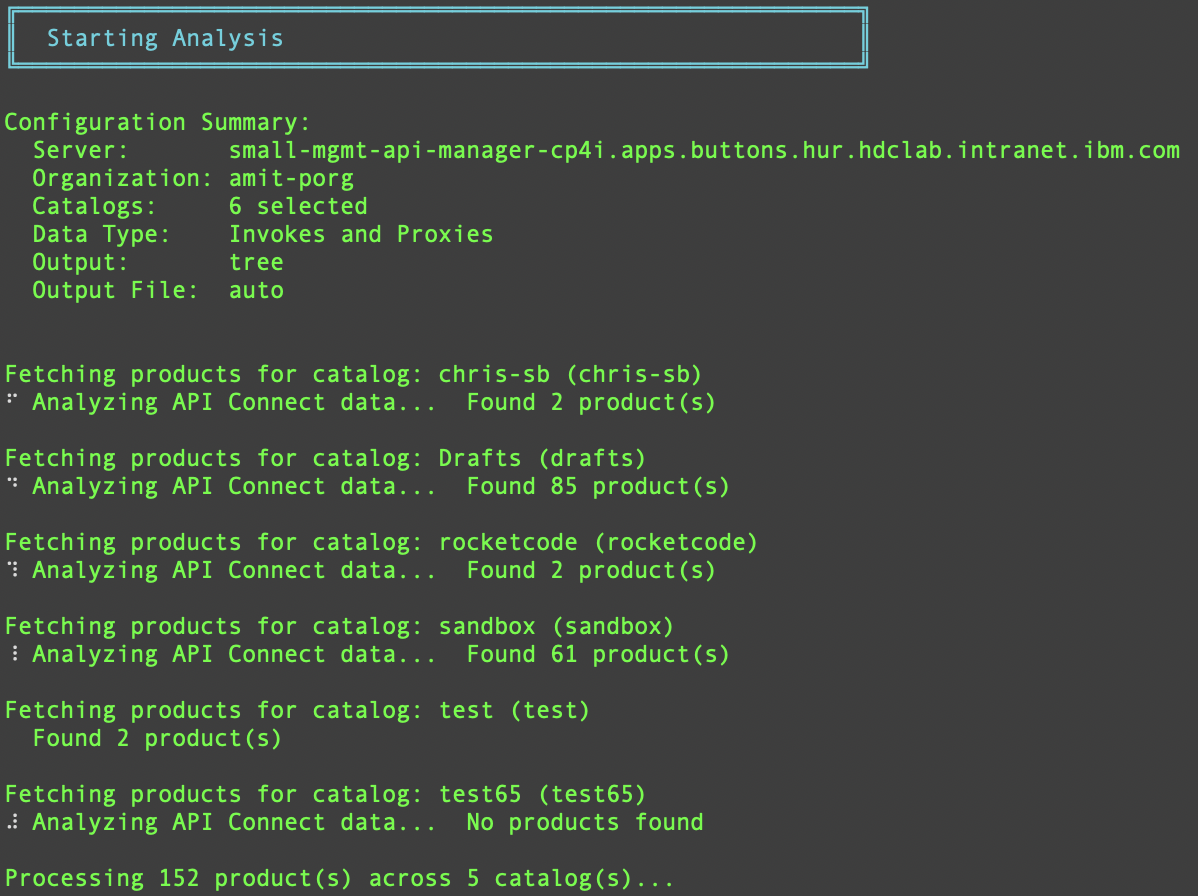 Figure 13: Real-time analysis with progress indicators
HTML Interface Features
The HTML interface provides powerful interactive features for exploring your API dependencies. The schema reordering panel allows you to drag and drop elements to reorganize your view, while real-time filtering helps you focus on specific components. The collapsible tree structure makes it easy to navigate even large API ecosystems.
Resources
- Source Code: [GitHub Repository]
- Documentation: See README.md in the repository
- Support: https://chrisphillips-cminion.github.io/
- Download: Get the latest release from GitHub
- Issues: Report bugs or request features on GitHub Issues
Quick Reference Card
# Installation
git clone <repository-url>
cd APIConnect-ImpactAnalysis
make build

# First Run (Interactive Setup)
./apicia

# Generate HTML Report
./apicia --html

# Generate JSON for Automation
./apicia --json --file output.json

# Generate CSV for Spreadsheets
./apicia --csv --file output.csv

# Use Custom Config
./apicia --load .apicia.prod --html

# Enable Debug Mode
./apicia --debug --html

# Check Version
./apicia --version

# Get Help
./apicia --help
Version History
v3.0.0 (Current)
- Enhanced schema reordering with Consumer Organization filtering
- Improved HTML interface responsiveness
- Fixed catalog hierarchy issues
- Better error handling and debug output
- Performance optimizations
Have you used APICIA in your environment? What insights did you discover? Share your experiences in the comments below!
Tags: #APIConnect #Tools #Analysis #Dependencies #Go #DevOps #API Management #ImpactAnalysis #Microservices