

Tuning API Connect Analytics
•
by
Chris Phillips

THIS ARTICLE HAS BEEN REPLACED with https://chrisphillips-cminion.github.io/apiconnect/2022/08/02/APIConnectAnalyticsTuning-2.html
As our customers grow their requirements grow. Recently I have been asked to tune the API Connect analytics subsystem for a through put of multi thousand transactions pers seconds.
The exact settings that are required will change from client to client depending on the hardware they have available and their requirements (e.g. payload size if its enabled)
Storage
You will need a fast block storage. Faster the better. The majority of the configuration I have seen are throttled because the content cannot be written to the disk fast enough. Recently I used a SAN that I could create PVCs directly on. This SAN does not need to be used for all APIConnect storage just the analytics data.
Understanding the bottlenecks
Requests come into the Analytics Subsystem
Storage Data
As I wrote above the majority of the bottlenecks come from the Storage Data pod not being able to write data fast enough. To see if the bottle neck is here follow these steps.
- Run your predicted workload through the API GW.
- Load a terminal in the storage data pod.
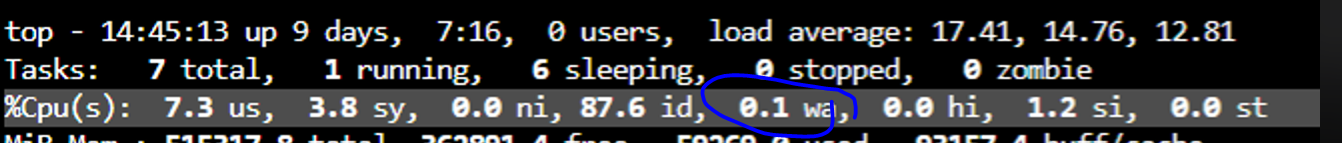
- Run top
- Look at the cpu wait time. If this is above 10% then it is probable that the disk is being thrashed.
CPU Utilisation
Assuming the above is ok,
- Run your predicted workload through the API GW.
- Look at the CPU metrics using
oc adm top poorkubectl top poand see if the CPU is hitting the limit of the ingestion and storage data pods. If this is less then 50% consumed then we can increase the thread counts.
Logs
The final areas to check for bottlenecks is in the DataPower logs. DataPower will report unable to connect to analytics or that it is being throttled.
Tuning
First of all I would increase the number of threads on the Storage Data Pod, this will drive up the CPU wait time, as we are sending more data at the same time to the disk .
- Edit the storage data statefulset to increase the PROCESSORS environment variable from 4 (default) to 50. We can set a higher limit here as many threads will be stuck waiting for the SAN to respond and so we can spawn additional threads.
- Storage Data pods will automatically restart, this will take a couple of mins.
- Repeat the storage data test above.
Second I would increase the number of Workers on the ingestion pod.
- Edit the Analytics CR and edit the following lines
pipelineBatchDelay: 10 pipelineBatchSize: 350 pipelineWorkers: 100 - These values may need to be tuned for your workload but they are my starting point.
- Manually restart the Ingestion pods
When you have applied the above settings validate the DataPower log and see if it reports any problems.
Conclusion
So this article shows how you can increase your analytics throughput without increasing the CPU or Memory. Though please note if you are seeing CPU utilisation of the Ingestion or Storage DataPod increasing you will need to increase the CPU limit of those pods.