

Enabling OpenTelemetry on IBM AppConnect Enterprise containers
• • by
•
Ben Cornwell
•
Chris Phillips

AppConnect Enterprise recommends enabling OpenTelemetry to provide end to end tracing.
This article will explain how to enable it in a new deployment or augment it to an existing deployment in ACE.
What is OpenTelemetry
Open Telemetry (or OTel for short) is an open framework for creating and managing telemetry data, which could be traces, metrics or logs. This is not an alternative to monitoring tools such as instana, rather it enhances Instana. OTel typically supports the handling of traces, metrics and logs.
- Metrics are time-aggregated series of data such as CPU usage over the last 5 minutes, or peak RAM usage in the last day. These help to identify performance problems.
- Traces are events triggered by a particular interaction that can be correlated to demonstrate the path that a message took through a system. Tracing is useful to for debugging as well as resolving performance problems.
- Logs are descriptive messages created by user code or the application runtime to signify that a particular thing has happened or a point in the code has been reached.
OTel is a framework and protocol for sending tracing, logging and monitoring data to a system that will store and handle it. This system is known as the back end. Applications can post messages directly to the back end, or they can send messages to an intermediary called the Collector. Either way, applications send messages to an endpoint, usually using an API library for the language that they use.
IBM ACE can use OTel for tracing purposes. Most common input and output message flow nodes can produce OTel events, along with nodes that invoke external systems. See https://www.ibm.com/docs/en/app-connect/12.0?topic=management-configuring-opentelemetry-trace-integration-server for more details.
Configuring OTel for ACE is simply a case of enabling it and specifying the endpoint.
Paramaters
| Parameter | Description | Default Value |
|---|---|---|
| enabled | enables the OpenTelemetry service in ACE | false |
| endpoint | (Optional) Where to send OpenTelemetry data to. If the collector is running as a DaemonSet on default ports this can be ignored | 172.21.181.253:4317 |
| protocol | (Optional) Forward the data via GRPC or HTTP/Json | grpc |
| tls.secretName | (Optional) Secret Containing the TLS Cert for securing communication to the collector. If SSL is not being used this should be left blank or not included in the YAML. | none |
| tls.caCertificate | (Optional) Secret Containing the CA Cert for securing communication to the collector. If SSL is not being used this should be left blank or not included in the YAML. | none |
Please note that if data is being sent to a direct endpoint outside of the existing node without TLS configured there is a risk it can be intercepted.
Enabling it for new deployments
When deploying a new instance of an IntegrationRuntime you can specify in the UI or the yaml. For the YAML add the snippet in the following section below. From the ACE Dashboard when you go through the wizard to deploy the integration runtime you see the image below.
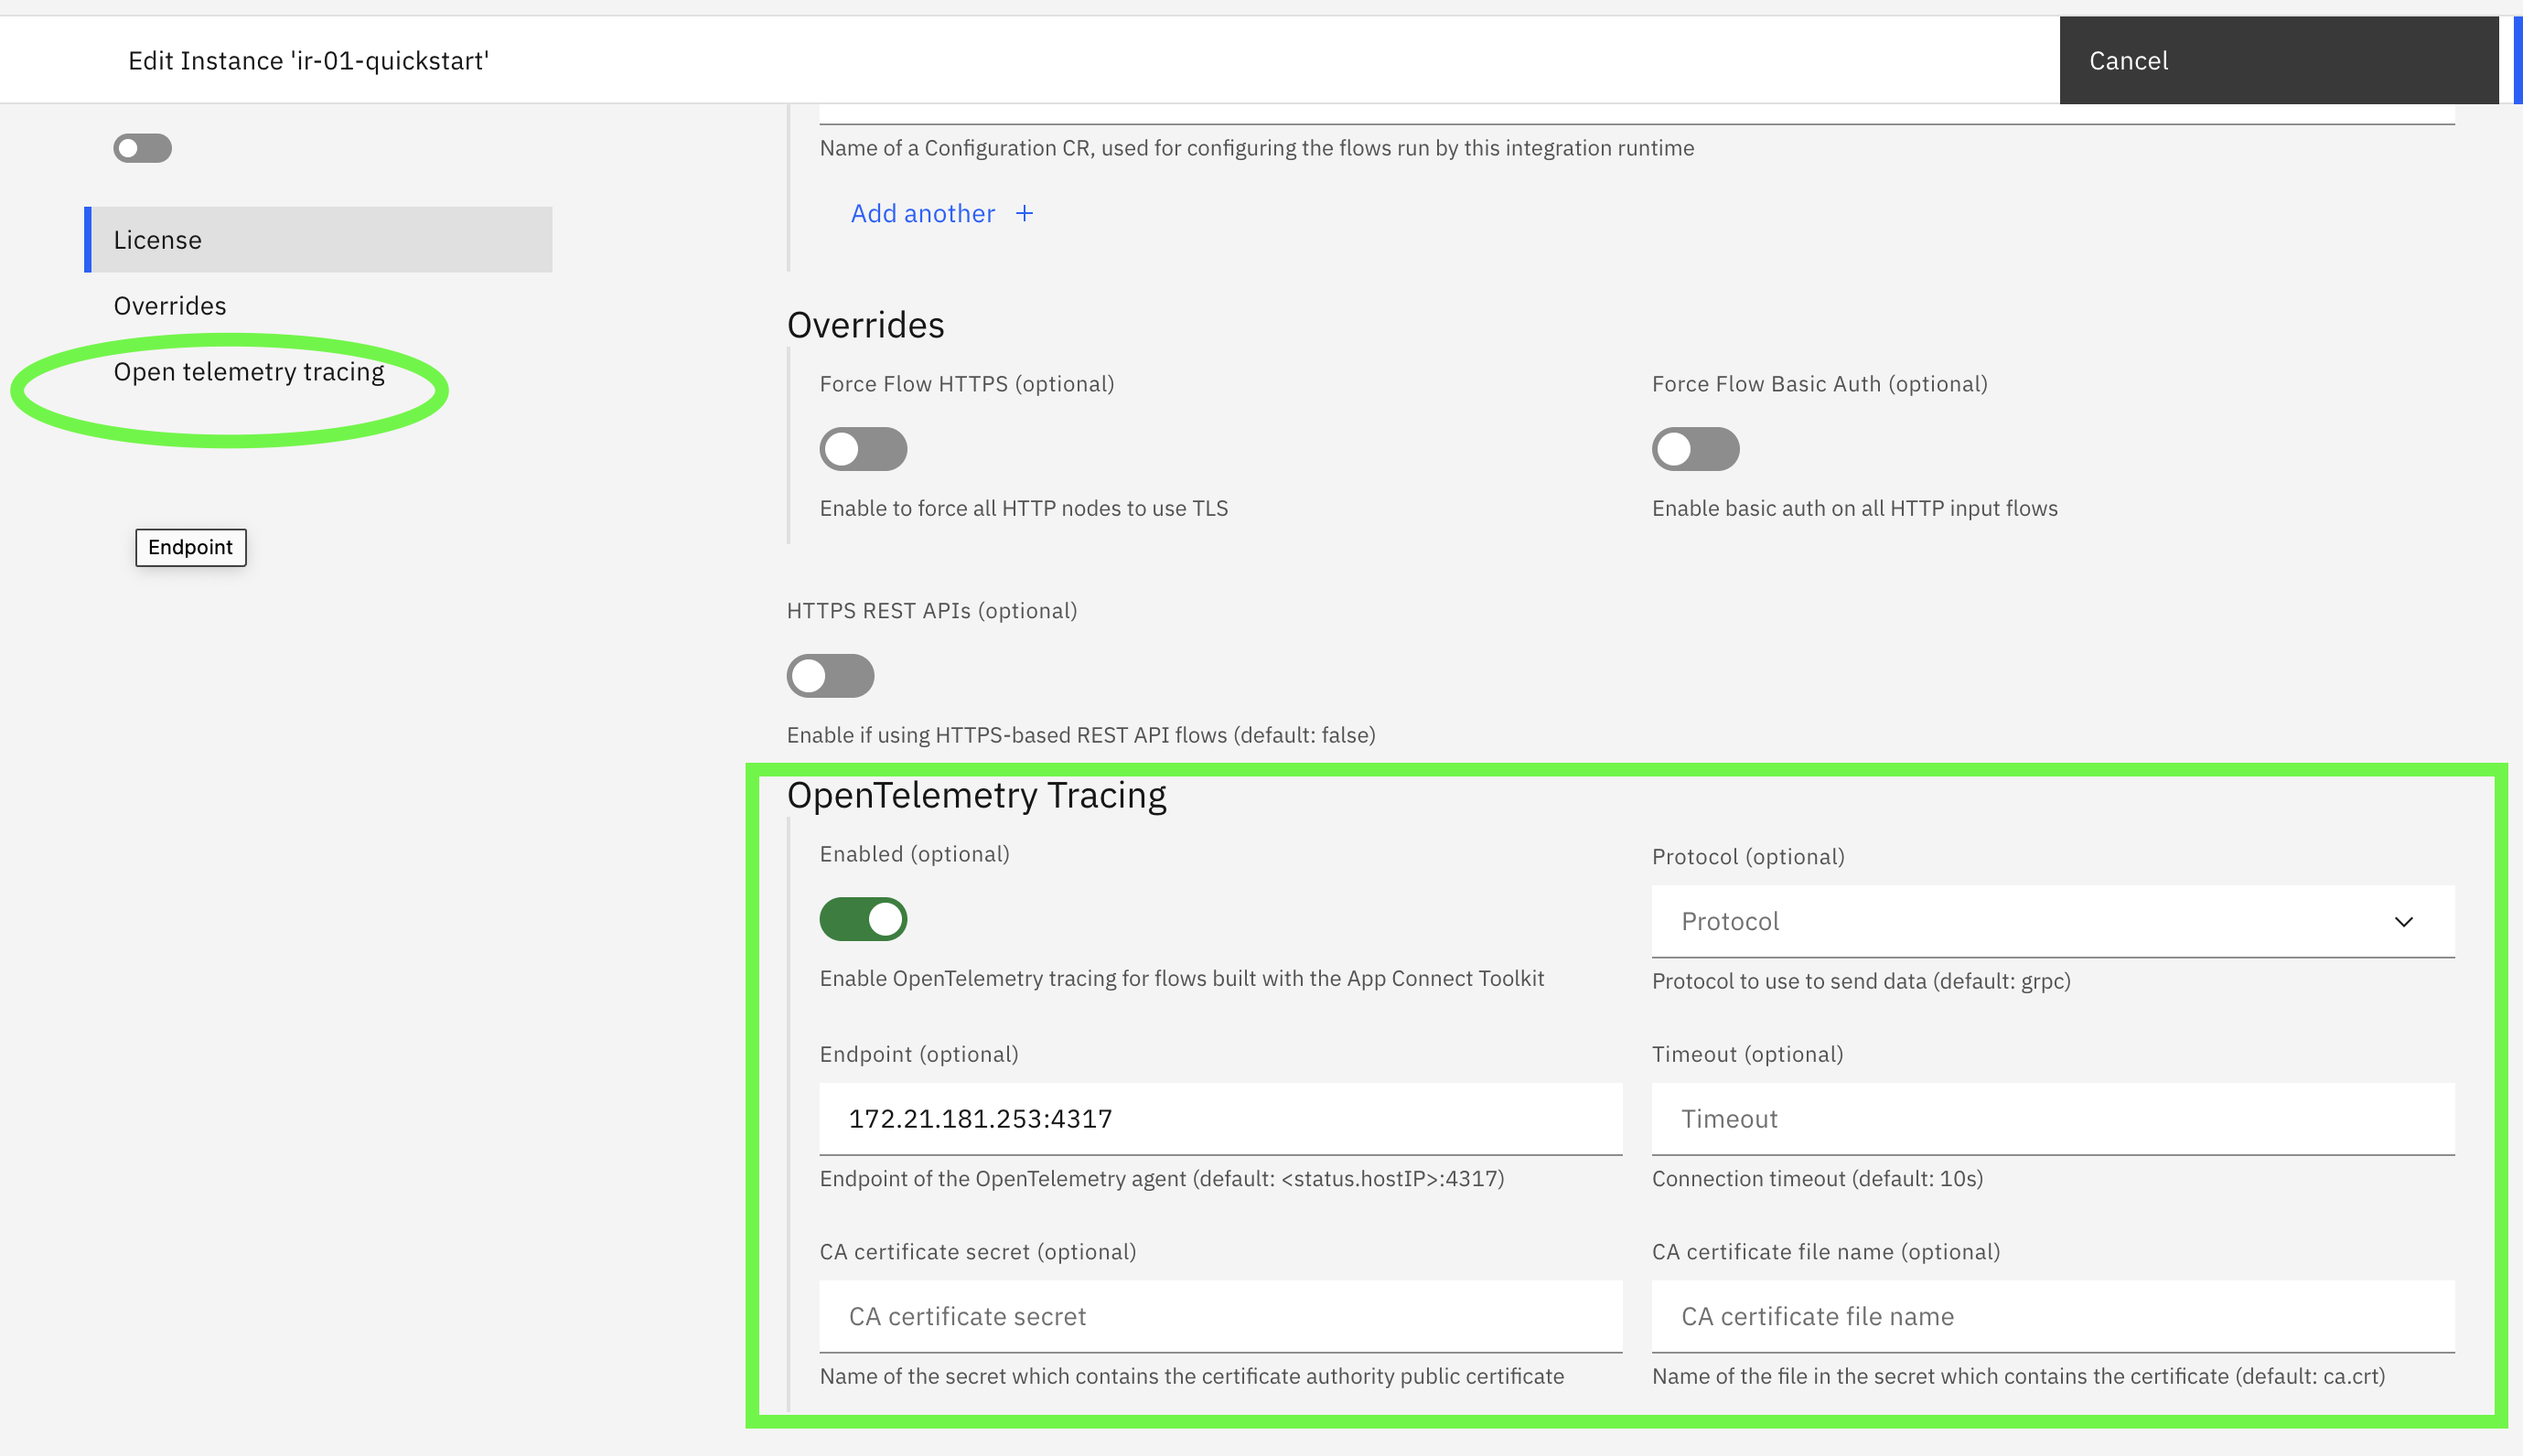
Once these settings are filled in it will push the data to the collector endpoint.
Enabling it for existing deployments
The easiest way to enable it for an existing deployment is to edit the IntegrationRuntime object. Please note this will cause the pods to restart in a controlled manner, if only one replica is running there will be an outage
oc edit integrationruntime <object instance name>
Then add the following code into the existing .spec with the correct endpoint and port for the openTelemetry target. If the collector is not secured with tls please omit the .tls section.
spec:
  telemetry:
    tracing:
     openTelemetry:
      enabled: true
      endpoint: 172.21.181.253:4317
      protocol: grpc
      tls:
        secretName: opentel-ca
        caCertificate: opentel-cert
This can also be done via the ACEDashboard by editing the IntegrationRuntime.